
🔴 Course description:
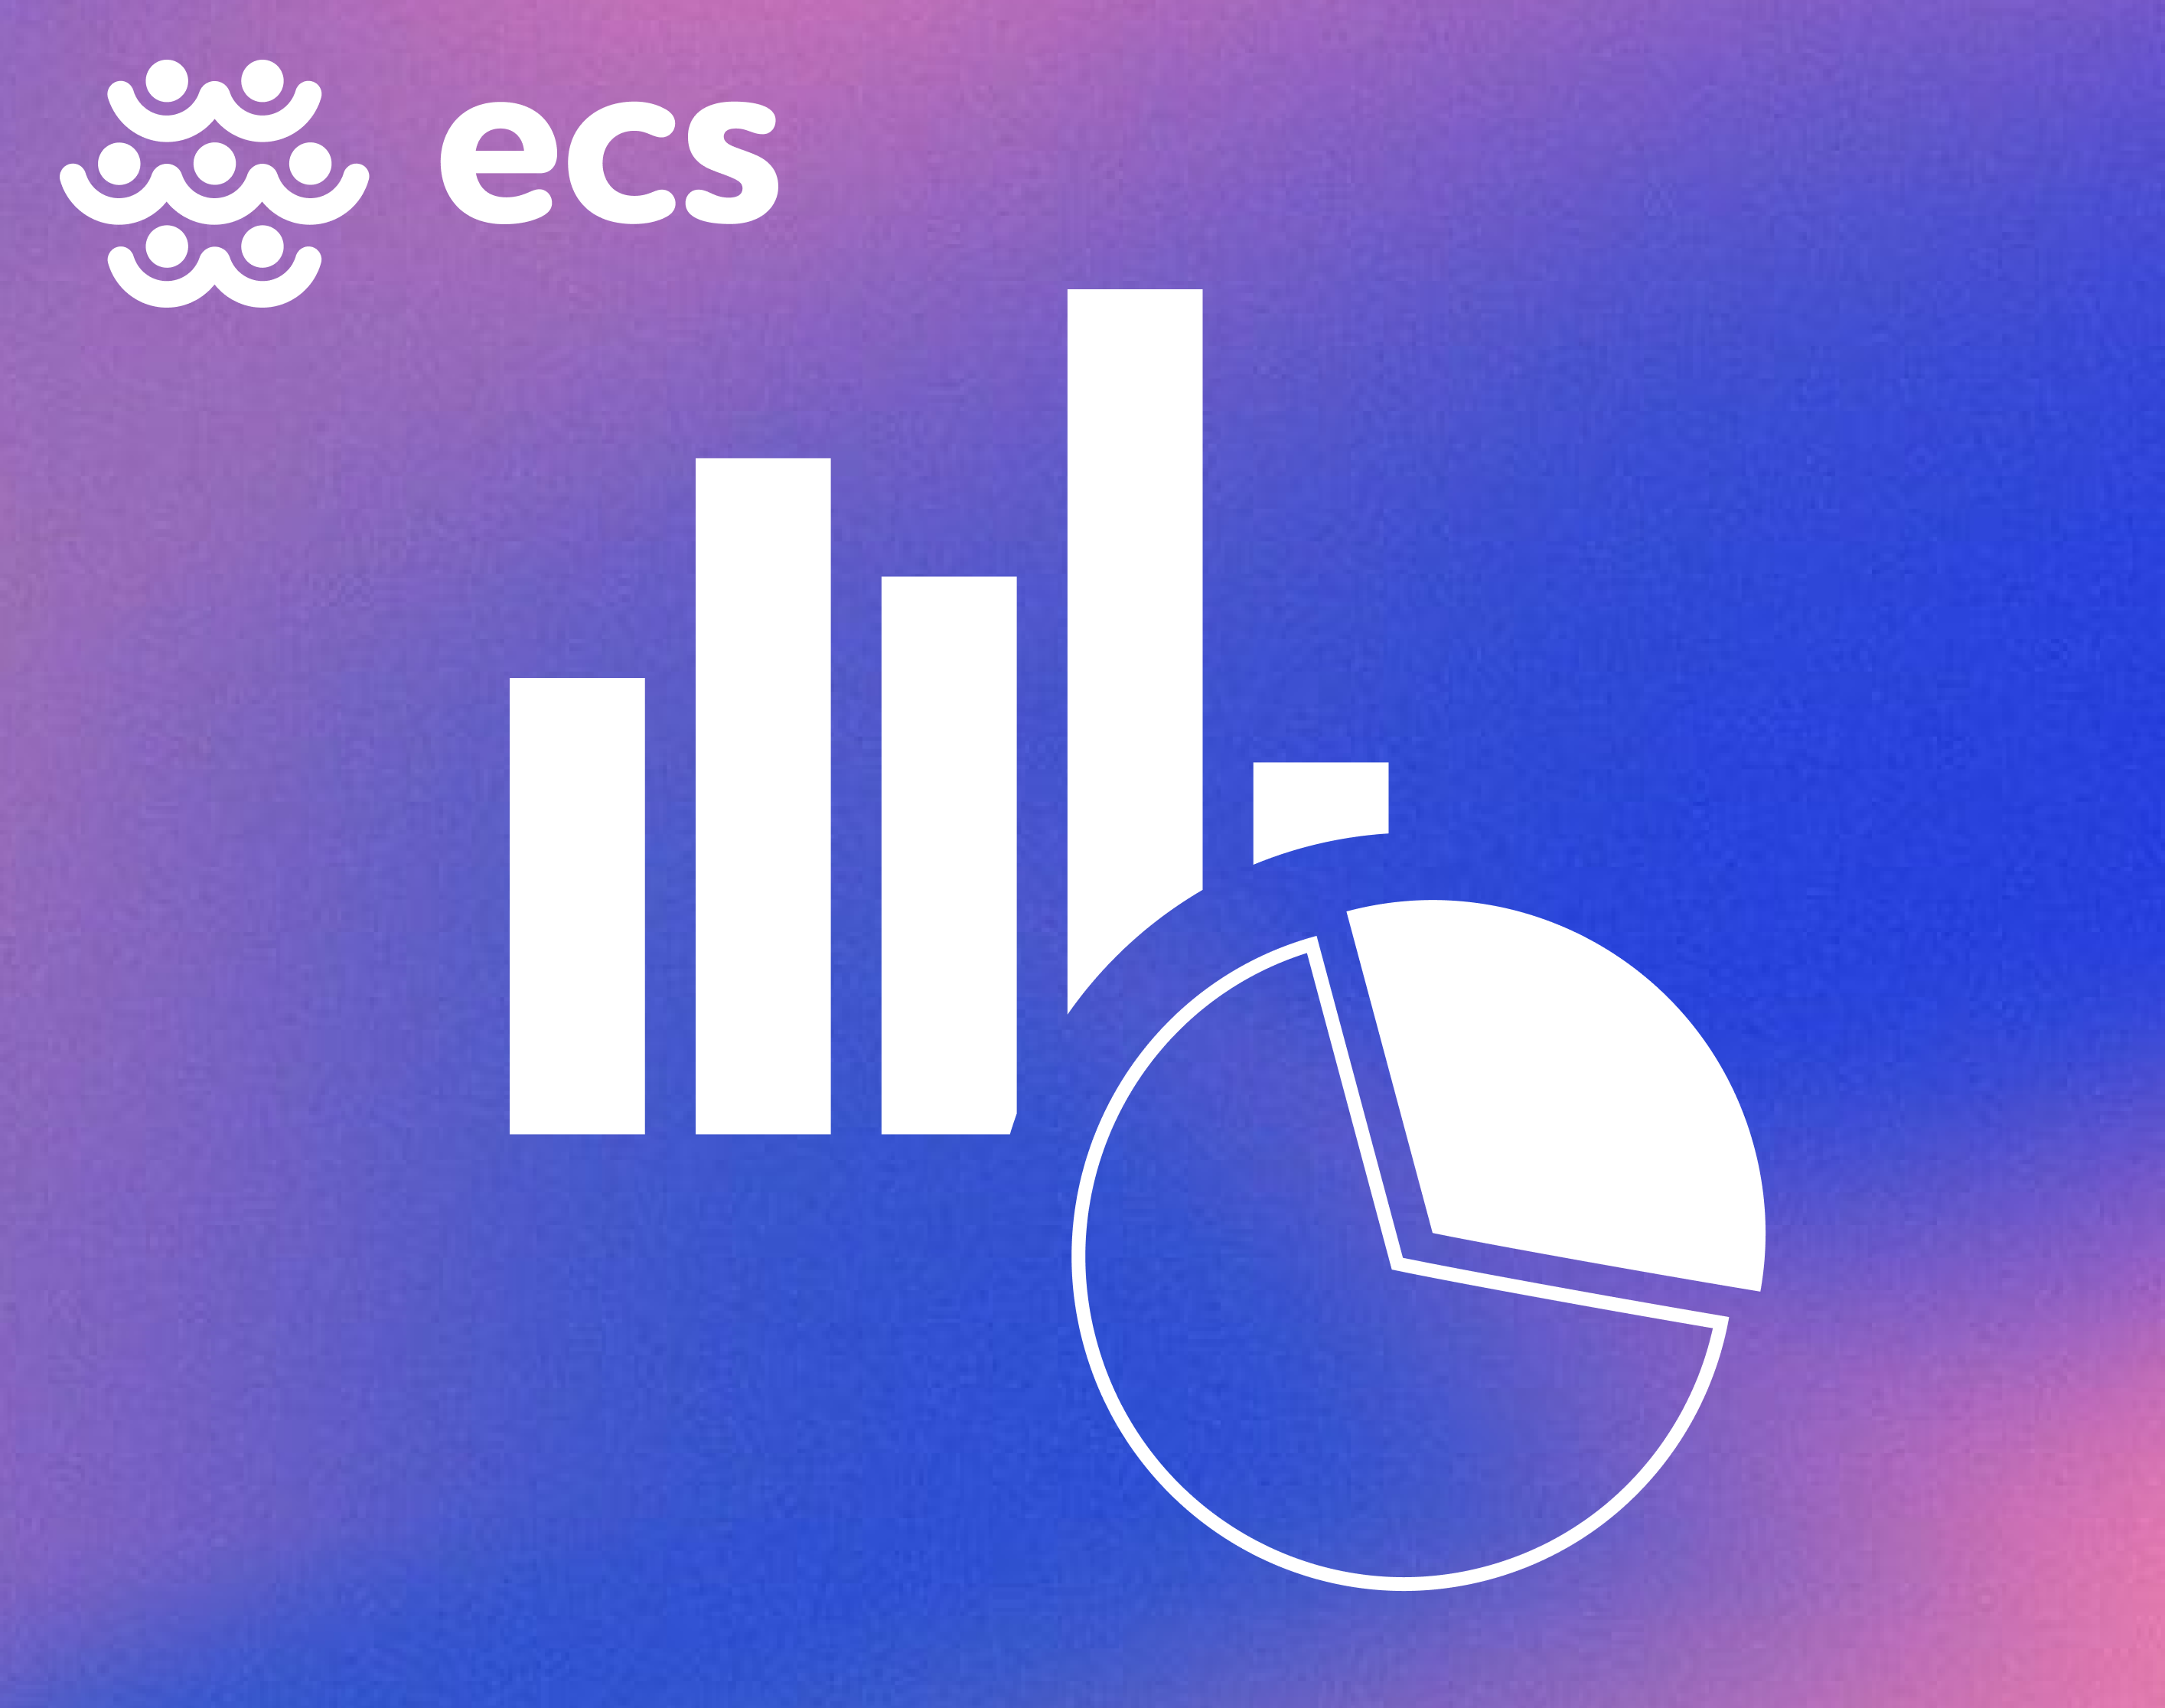
Welcome to the “Data Visualization in Python” course. This free course is designed for beginners, takes approximately 3 hours to complete and provides a comprehensive introduction to creating visualizations using various Python libraries. While no prior knowledge of these libraries is required (Matplotlib, GGPlot, Seaborn and Bokeh), it is recommended that you have completed the previous courses in the “Data Analysis and Visualization” learning path.
This course covers:
- Matplotlib: Learn the fundamentals of Matplotlib, including installation, basic plotting techniques, and customization options to create a wide range of static visualizations.
- GGPLOT: Explore GGPLOT, a library that allows you to create complex and aesthetically pleasing plots using its grammar of graphics, enhancing your ability to produce sophisticated visual representations.
- Seaborn: Understand Seaborn, a statistical data visualization library built on top of Matplotlib, to create informative and attractive statistical plots.
- Bokeh: Discover Bokeh, a library for creating interactive and web-ready plots, enabling you to develop interactive visualizations that can be easily shared online.
- Final Test: Apply everything you’ve learned in real-world scenarios, facing exercises that simulate complex data analysis tasks with access to external databases.
By the end of this course, you will have a strong understanding of various data visualization libraries in Python and be well-prepared to create both static and interactive visualizations for your data analysis projects.
This course is part of the “Data Analysis and Visualization” learning path, which includes the following courses:
- Introduction to Jupyter Notebooks
- Introduction to Python
- Introduction to NumPy
- Introduction to Pandas
- Data visualization in Python
These courses are designed to be taken in sequence to build a solid foundation in data analysis and visualization.
💡Access information
While the ECS Academy aims to make all its courses accessible to guests (no registration required), the courses belonging to the Data Analysis and Visualization learning path require users to be registered.
This is due to their specific technological setup linked to each individual account.
Self-enrollment: To self- enroll first create your account on the citizenscience.eu platform - then on the ECS Academy (it is a two step process). Once you have created your account on the ECS Academy you will be able to enroll without a key.